Python可视化分析和预测了2022年FIFA世界杯
来源:
奇酷教育 发表于:
Python可视化分析和预测了2022年FIFA世界杯
高端的效果,往往只需要采用最朴素的实现方式。

Python可视化分析和预测了2022年FIFA世界杯。
经过测试,本文建立的模型能成功地预测了在20-21赛季中期的所有英超、西甲、意甲和德甲这些联赛的冠军,这也是基于当时已经有近19场比赛了。同样,我们使用该模型来预测下2022年世界杯,会不会有如此惊人的效果呢?一起拭目以待吧~
如何预测比赛呢?
有不同的方法来进行预测。我可以建立一个花哨的机器学习模型并给它提供多个变量,但在阅读了一些论文后,我决定使用泊松分布试一试。
泊松分布
有读者会疑问,这是为什么呢?那接下来首先看一下泊松分布的定义。
泊松分布是一个离散的概率分布,描述了在一个固定的时间间隔或机会区域内发生的事件的数量。
如果我们把进球看作是一场足球比赛90分钟内可能发生的事件,我们可以计算出A队和B队在一场比赛中可能进球的概率。
但这还不够。我们仍然需要满足泊松分布的假设。
可以计算事件的数量(一场比赛可以有1、2、3或更多的进球)。
事件的发生是独立的(一个目标的发生不应影响另一个目标的概率)。
事件发生的速度是恒定的(在某一时间间隔内发生目标的概率对于相同长度的其他每一个时间间隔都应该是完全相同的)。
两个事件不可能在完全相同的时间内发生(两个目标不可能同时发生)
毫无疑问,假设1和4是符合的,但2和3是部分正确的。也就是说,我们假设假设2和3总是正确的。
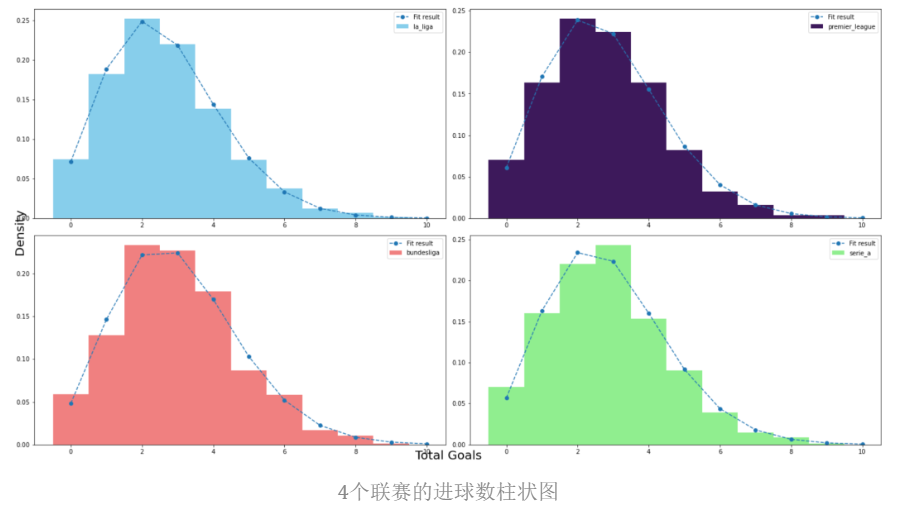
当预测欧洲顶级联赛的冠军时,我绘制了过去5年前4个联赛每场比赛的进球数柱状图。
4个联赛的进球数柱状图
如果你看一下任何联赛的拟合曲线,它看起来像泊松分布。

现在我们可以说,可以用泊松分布来计算一场比赛中可能出现的进球数的概率。
下面是泊松分布的公式。
为了进行预测,我考虑了。
lambda:90分钟内进球数的中位数(A队和B队)。
x:一场比赛中A队和B队可能进的球数
为了计算lambda,我们需要每个国家队的平均进/丢球数。这将我们引向下一个问题。
每个国家队的进球/丢球情况
在收集了从1930年到2018年的所有世界杯比赛的数据(需要完整数据请扫文末二维码后,回复:世界杯 获取)后,可以计算出每个国家队的平均进球和丢球情况。
数据清洗
读取数据
df_historical_data = pd.read_csv('data/fifa_worldcup_matches.csv')
df_fixture = pd.read_csv('data/fifa_worldcup_fixture.csv')
df_missing_data = pd.read_csv('data/fifa_worldcup_missing_data.csv')
清洗df_fixture
df_fixture['home'] = df_fixture['home'].str.strip()
df_fixture['away'] = df_fixture['away'].str.strip()
清洗df_missing_data
df_missing_data.dropna(inplace=True)
df_historical_data = pd.concat([df_historical_data, df_missing_data], ignore_index=True)
df_historical_data.drop_duplicates(inplace=True)
df_historical_data.sort_values('year', inplace=True)
df_historical_data
清洗df_historical_data
# 删掉与走过场的比赛
delete_index = df_historical_data[df_historical_data['home'].str.contains('Sweden') &
df_historical_data['away'].str.contains('Austria')].index
df_historical_data.drop(index=delete_index, inplace=True)
# 清洗分数和主客场columns
df_historical_data['score'] = df_historical_data['score'].str.replace('[^\d–]', '', regex=True)
df_historical_data['home'] = df_historical_data['home'].str.strip() # 清洗空白格: Yugoslavia twice
df_historical_data['away'] = df_historical_data['away'].str.strip()
# splitting score columns into home and away goals and dropping score column
# 将得分columns分成主客场进球和降分columns
df_historical_data[['HomeGoals', 'AwayGoals']] = df_historical_data['score'].str.split('–', expand=True)
df_historical_data.drop('score', axis=1, inplace=True)
# 重命名列名并更改格式
df_historical_data.rename(columns={'home': 'HomeTeam', 'away': 'AwayTeam',
'year':'Year'}, inplace=True)
df_historical_data = df_historical_data.astype({'HomeGoals': int, 'AwayGoals':int, 'Year': int})
# 创建一个新列 "totalgoals"
df_historical_data['TotalGoals'] = df_historical_data['HomeGoals'] + df_historical_data['AwayGoals']
df_historical_data
保存清洗过后的数据
df_historical_data.to_csv('clean_fifa_worldcup_matches.csv',index=False)
df_fixture.to_csv('clean_fifa_worldcup_fixture.csv',index=False)
数据可视化
上下滑动查看更多源码
# nation_position, club_position, player_positions
df = pd.read_csv('players_22.csv', low_memory=False)
# 选择需要用的列
df = df[['short_name', 'age', 'nationality_name', 'overall', 'potential',
'club_name', 'value_eur', 'wage_eur', 'player_positions']]
# 只选择一个position
df['player_positions'] = df['player_positions'].str.split(',', expand=True)[0]
# 删除缺失值
df.dropna(inplace=True)
players_missing_worldcup = ['K. Benzema', 'S. Mané', 'S. Agüero', 'Sergio Ramos',
'P. Pogba', 'M. Reus', 'Diogo Jota', 'A. Harit',
'N. Kanté', 'G. Lo Celso', 'Piqué']
# 删除受伤的球员
drop_index = df[df['short_name'].isin(players_missing_worldcup)].index
df.drop(drop_index, axis=0, inplace=True)
teams_worldcup = [
'Qatar', 'Brazil', 'Belgium', 'France', 'Argentina', 'England', 'Spain', 'Portugal',
'Mexico', 'Netherlands', 'Denmark', 'Germany', 'Uruguay', 'Switzerland', 'United States', 'Croatia',
'Senegal', 'Iran', 'Japan', 'Morocco', 'Serbia', 'Poland', 'South Korea', 'Tunisia',
'Cameroon', 'Canada', 'Ecuador', 'Saudi Arabia', 'Ghana', 'Wales', 'Costa Rica', 'Australia'
]
# 筛选国家队
df = df[df['nationality_name'].isin(teams_worldcup)]
# 最佳球员
df.sort_values(by=['overall', 'potential', 'value_eur'], ascending=False, inplace=True)
球员分布
import numpy as np
fig, ax = plt.subplots(figsize=(12, 5), tight_layout=True)
sns.histplot(df, x='overall', binwidth=1)
bins = np.arange(df['overall'].min(), df['overall'].max(), 1)
plt.xticks(bins)
plt.show()
世界杯梦之队球员
df.drop_duplicates('player_positions')
每个国家队中最有技能的球员
df_best_players = df.copy()
df_best_players = df_best_players.drop_duplicates('nationality_name').reset_index(drop=True)
country_short = df_best_players['nationality_name'].str.extract('(^\w{3})', expand=False).str.upper()
df_best_players['name_nationality'] = df_best_players['short_name'] +' (' + country_short + ')'
fig, ax = plt.subplots(figsize=(10, 6), tight_layout=True)
sns.barplot(df_best_players, x='overall', y='name_nationality',
palette=sns.color_palette('pastel'), width=0.5)
plt.show()
每支球队的最佳阵容
def best_squad(nationality):
df_best_squad = df.copy()
df_best_squad = df_best_squad.groupby(['nationality_name', 'player_positions']).head(2)
df_best_squad = df_best_squad[df_best_squad['nationality_name']==nationality].sort_values(['player_positions', 'overall', 'potential'], ascending=False)
return df_best_squad
best_squad('Brazil')
average_overall = [best_squad(team)['overall'].mean() for team in teams_worldcup]
df_average_overall = pd.DataFrame({'Teams': teams_worldcup, 'AVG_Overall': average_overall})
df_average_overall = df_average_overall.dropna()
df_average_overall = df_average_overall.sort_values('AVG_Overall', ascending=False)
df_average_overall
上下滑动查看更多结果
fig, ax = plt.subplots(figsize=(12, 5), tight_layout=True)
sns.barplot(df_average_overall[:10], x='Teams', y='AVG_Overall',
palette=sns.color_palette('pastel'))
plt.show()
每支球队的最佳阵型
上下滑动查看更多源码
def best_lineup(nationality, lineup):
lineup_count = [lineup.count(i) for i in lineup]
df_lineup = pd.DataFrame({'position': lineup, 'count': lineup_count})
positions_non_repeated = df_lineup[df_lineup['count'] <= 1]['position'].values
positions_repeated = df_lineup[df_lineup['count'] > 1]['position'].values
df_squad = best_squad(nationality)
df_lineup = pd.concat([
df_squad[df_squad['player_positions'].isin(positions_non_repeated)].drop_duplicates('player_positions', keep='first'),
df_squad[df_squad['player_positions'].isin(positions_repeated)]]
)
return df_lineup[['short_name', 'overall', 'club_name', 'player_positions']]
dict_formation = {
'4-3-3': ['GK', 'RB', 'CB', 'CB', 'LB', 'CDM', 'CM', 'CAM', 'RW', 'ST', 'LW'],
'4-4-2': ['GK', 'RB', 'CB', 'CB', 'LB', 'RM', 'CM', 'CM', 'LM', 'ST', 'ST'],
'4-2-3-1': ['GK', 'RB', 'CB', 'CB', 'LB', 'CDM', 'CDM', 'CAM', 'CAM', 'CAM', 'ST'],
}
for index, row in df_average_overall[:9].iterrows():
max_average = None
for key, values in dict_formation.items():
average = best_lineup(row['Teams'], values)['overall'].mean()
if max_average is None or average>max_average:
max_average = average
formation = key
print(row['Teams'], formation, max_average)
Spain 4-2-3-1 85.1
Portugal 4-2-3-1 84.9
England 4-4-2 84.45454545454545
Brazil 4-3-3 84.81818181818181
France 4-2-3-1 83.9
Argentina 4-3-3 83.54545454545455
Germany 4-2-3-1 84.1
Belgium 4-3-3 82.54545454545455
Netherlands 4-4-2 82.54545454545455
# best_lineup('Spain', dict_formation['4-2-3-1'])
# best_lineup('Argentina', dict_formation['4-3-3'])
best_lineup('Brazil', dict_formation['4-3-3'])
由于在世界杯中,几乎所有的球队都在中立球场比赛,所以在这次分析中没有考虑主场/客场的因素。
一旦有了每个国家队的进/丢球数,就创建了一个函数,预测每支球队在小组赛中会得到多少分。
预测小组赛阶段
下面是我用来预测每个国家队在小组赛阶段会得到多少分的代码。
计算球队实力
dict_table = pickle.load(open('dict_table','rb'))
df_historical_data = pd.read_csv('clean_fifa_worldcup_matches.csv')
df_fixture = pd.read_csv('clean_fifa_worldcup_fixture.csv')
df_home = df_historical_data[['HomeTeam', 'HomeGoals', 'AwayGoals']]
df_away = df_historical_data[['AwayTeam', 'HomeGoals', 'AwayGoals']]
df_home = df_home.rename(columns={'HomeTeam':'Team', 'HomeGoals': 'GoalsScored', 'AwayGoals': 'GoalsConceded'})
df_away = df_away.rename(columns={'AwayTeam':'Team', 'HomeGoals': 'GoalsConceded', 'AwayGoals': 'GoalsScored'})
df_team_strength = pd.concat([df_home, df_away], ignore_index=True).groupby(['Team']).mean()
df_team_strength
from scipy.stats import poisson
def predict_points(home, away):
if home in df_team_strength.index and away in df_team_strength.index:
lamb_home = df_team_strength.at[home,'GoalsScored'] * df_team_strength.at[away,'GoalsConceded']
lamb_away = df_team_strength.at[away,'GoalsScored'] * df_team_strength.at[home,'GoalsConceded']
prob_home, prob_away, prob_draw = 0, 0, 0
for x in range(0,11): #number of goals home team
for y in range(0, 11): #number of goals away team
p = poisson.pmf(x, lamb_home) * poisson.pmf(y, lamb_away)
if x == y:
prob_draw += p
elif x > y:
prob_home += p
else:
prob_away += p
points_home = 3 * prob_home + prob_draw
points_away = 3 * prob_away + prob_draw
return (points_home, points_away)
else:
return (0, 0)
通俗地说,predict_points 计算的是主队和客队会得到多少分。这里使用公式计算每支球队的lambda,即average_goals_scored * average_goals_conceded 。
然后模拟了一场比赛从0-0到10-10的所有可能的比分(最后的那个比分只是我的进球范围的极限)。一旦有了lambda和x,就可以使用泊松分布的公式来计算p。
prob_home、prob_draw和prob_away分别累积了p的值,如果说比赛以1-0(主场获胜)、1-1(平局)或0-1(客场获胜)结束。最后,用下面的公式计算积分。
point_home = 3 * prob_home + prob_draw
point_away = 3 * prob_away + prob_draw
如果我们用predict_points来预测英格兰对美国的比赛,我们会得到这个结果。
>>> print(predict_points('England', 'United States'))
(2.2356147635326007, 0.5922397535606193)
这意味着英格兰将得到2.23分,而美国将得到0.59分。因为这里使用的是概率,因此得到的是小数。
如果将这个predict_points函数应用于小组赛阶段的所有比赛,我们将得到每个小组的第1和第2名,从而得到以下淘汰赛的比赛。
df_fixture_group_48 = df_fixture[:48].copy()
df_fixture_knockout = df_fixture[48:56].copy()
df_fixture_quarter = df_fixture[56:60].copy()
df_fixture_semi = df_fixture[60:62].copy()
df_fixture_final = df_fixture[62:].copy()
for group in dict_table:
teams_in_group = dict_table[group]['Team'].values
df_fixture_group_6 = df_fixture_group_48[df_fixture_group_48['home'].isin(teams_in_group)]
for index, row in df_fixture_group_6.iterrows():
home, away = row['home'], row['away']
points_home, points_away = predict_points(home, away)
dict_table[group].loc[dict_table[group]['Team'] == home, 'Pts'] += points_home
dict_table[group].loc[dict_table[group]['Team'] == away, 'Pts'] += points_away
dict_table[group] = dict_table[group].sort_values('Pts', ascending=False).reset_index()
dict_table[group] = dict_table[group][['Team', 'Pts']]
dict_table[group] = dict_table[group].round(0)
dict_table['Group A']
图片
图片
预测淘汰赛
df_fixture_knockout
图片
for group in dict_table:
group_winner = dict_table[group].loc[0, 'Team']
runners_up = dict_table[group].loc[1, 'Team']
df_fixture_knockout.replace({f'Winners {group}':group_winner,
f'Runners-up {group}':runners_up}, inplace=True)
df_fixture_knockout['winner'] = '?'
df_fixture_knockout
图片
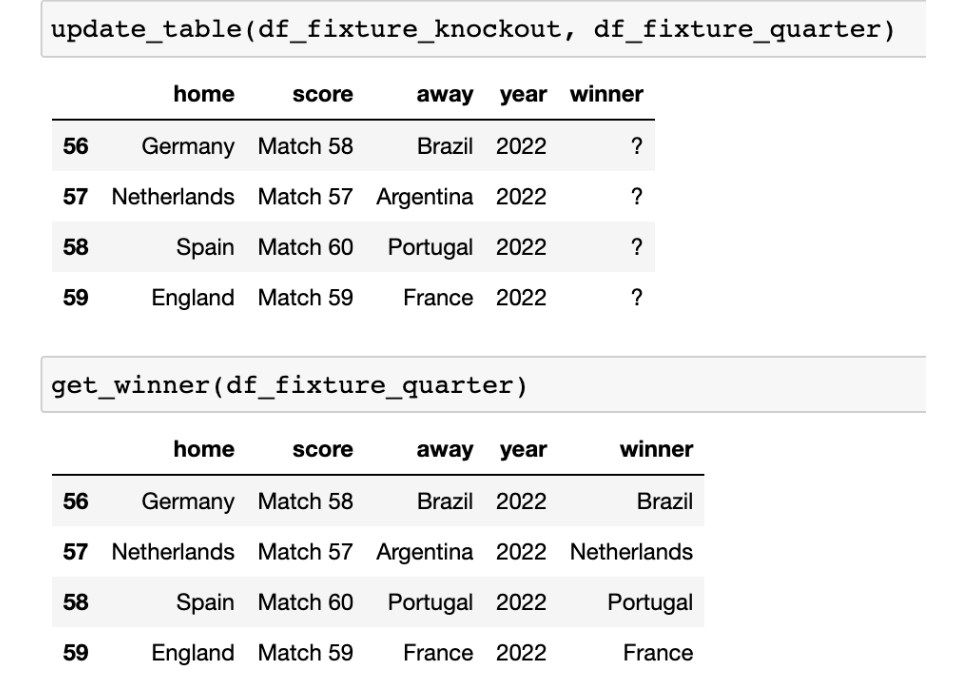
对于淘汰赛,我不需要预测分数,而是预测每个小组的获胜者。这就是为什么我在之前的 predict_points 函数基础上创建了一个新的 get_winner 函数。
def get_winner(df_fixture_updated):
for index, row in df_fixture_updated.iterrows():
home, away = row['home'], row['away']
points_home, points_away = predict_points(home, away)
if points_home > points_away:
winner = home
else:
winner = away
df_fixture_updated.loc[index, 'winner'] = winner
return df_fixture_updated
简单地说,如果主队的积分大于客队的积分,那么赢家就是主队,否则,赢家就是客队。
使用get_winner函数可以得到如下的结果。
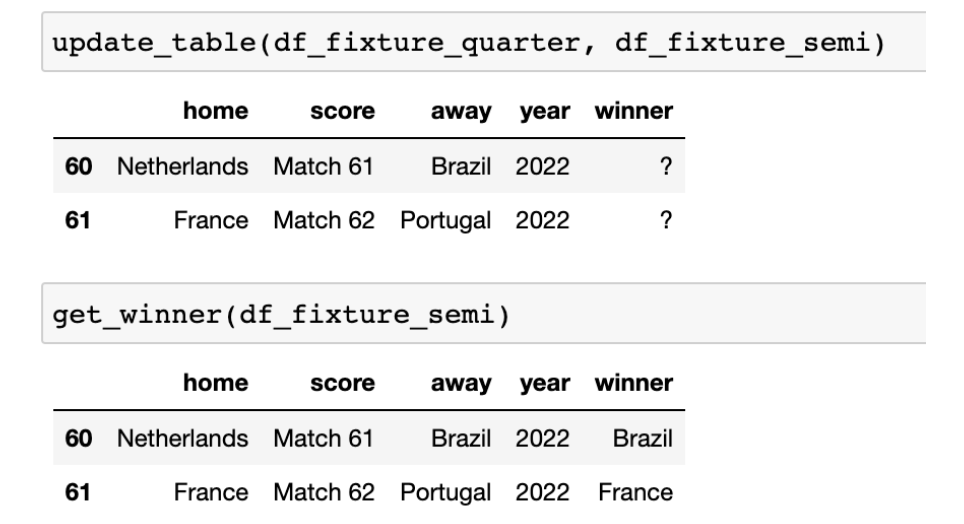
预测四分之一决赛、半决赛和决赛的情况
def update_table(df_fixture_round_1, df_fixture_round_2):
for index, row in df_fixture_round_1.iterrows():
winner = df_fixture_round_1.loc[index, 'winner']
match = df_fixture_round_1.loc[index, 'score']
df_fixture_round_2.replace({f'Winners {match}':winner}, inplace=True)
df_fixture_round_2['winner'] = '?'
return df_fixture_round_2
四分之一决赛
半决赛
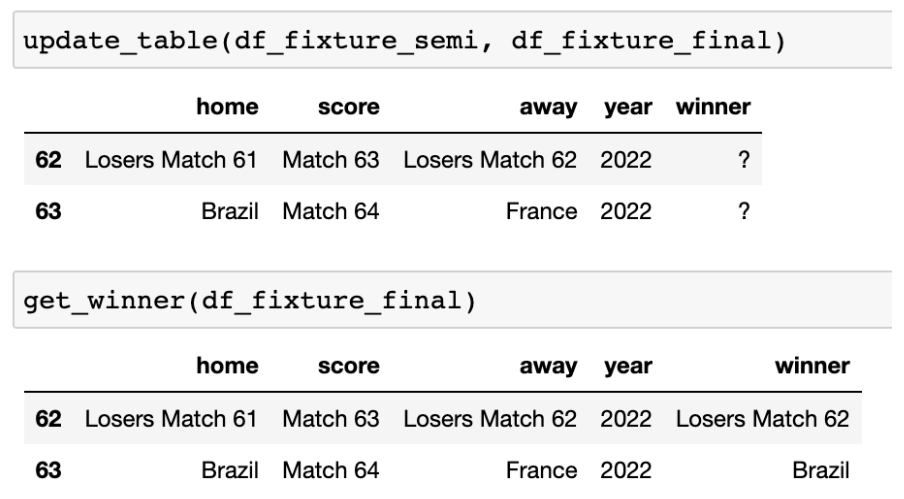
决赛
如果我使用 get_winner,我可以预测世界杯的冠军。这是最后的结果!!
通过再一次运行该函数,我得到的赢家是...巴西!
(如有雷同纯属巧合)